
Highlights of the Quarter
(unless otherwise noted, all financial amounts in this news release are expressed in U.S. dollars)
-
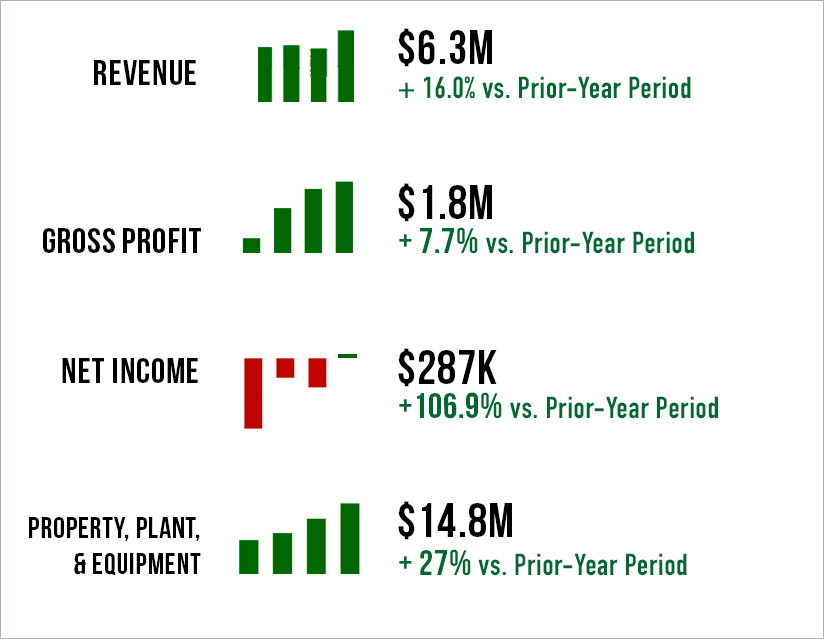
- IBC achieves another profitable quarter with comprehensive income of $287,000 in the quarter, or $0.00 per share, a 107% increase over comprehensive income of $139,000, or $0.00, in the prior-year period.
- IBC achieves another profitable quarter with comprehensive income of $287,000 in the quarter, or $0.00 per share, a 107% increase over comprehensive income of $139,000, or $0.00, in the prior-year period.
-
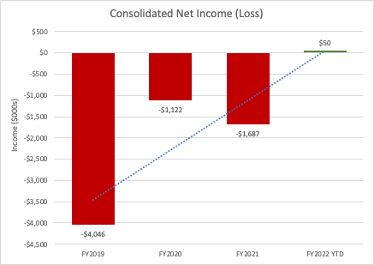
- IBC generates profit for the nine-month period to March 31, 2022 of the current fiscal year, which is the first time the Company has achieved this milestone.
- IBC generates profit for the nine-month period to March 31, 2022 of the current fiscal year, which is the first time the Company has achieved this milestone.
-
- Consolidated sales jump by 16.0% and 38.8% in the 3 and 9 months ended March 31, 2022, over the prior-year periods.
- Consolidated sales jump by 16.0% and 38.8% in the 3 and 9 months ended March 31, 2022, over the prior-year periods.
-
- Copper Alloys division swings to profitability in the quarter as production continues to ramp up at its newly consolidated and expanded foundry in Indiana.
- Copper Alloys division swings to profitability in the quarter as production continues to ramp up at its newly consolidated and expanded foundry in Indiana.
-
- Engineered Materials division achieves sixth straight quarter of profitability as sales of beryllium-aluminum products rose by 37.7% and 91.4%, respectively, in the 3 and 9 months ended March 31, 2022, over the prior-year periods.
- Engineered Materials division achieves sixth straight quarter of profitability as sales of beryllium-aluminum products rose by 37.7% and 91.4%, respectively, in the 3 and 9 months ended March 31, 2022, over the prior-year periods.
-
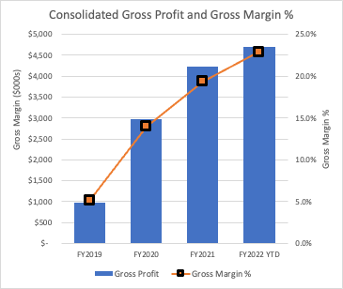
- Year-to-date (“YTD”) gross profit continues to climb steadily over the past 3+ years.
- Year-to-date (“YTD”) gross profit continues to climb steadily over the past 3+ years.
-
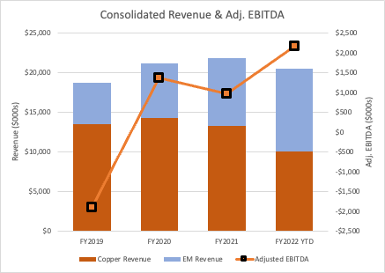
- Year-to-Date Adjusted EBITDA1 in the quarter jumped by 24.5% over the prior-year period and was 157.4% higher in the nine months ended March 31, 2022, than in the prior-year period.
- Year-to-Date Adjusted EBITDA1 in the quarter jumped by 24.5% over the prior-year period and was 157.4% higher in the nine months ended March 31, 2022, than in the prior-year period.
- Company to host live investor webcast at 1 PM Eastern, Tuesday, May 31, 2022. Registration is here: https://attendee.gotowebinar.com/register/1862211381517756687
FRANKLIN, IN / ACCESSWIRE / May 30, 2022 / IBC Advanced Alloys Corp. (“IBC” or the “Company“) (TSX-V:IB; OTCQB:IAALF) announces its financial results for the quarter ended March 31, 2022.
IBC booked another profitable quarter with comprehensive income of $287,000 in the quarter, or $0.00 per share, a 107% increase over comprehensive income of $139,000, or $0.00, in the prior-year period. This quarter’s success marks IBC’s second consecutive quarter of profitable operations, and it is the first time in the Company’s history that it has remained profitable after three quarters of operations in a fiscal year.
Consolidated sales of $6.3 million in the quarter increased by 16.0% over the prior-year period and were higher by 38.8% in the nine months ended March 31, 2022, over the comparable prior-year period.
Copper Alloy division sales of $3.3 million in the quarter rose by 1.7% as compared to the prior-year period and were higher by 8.0% in the nine-month period ended March 31, 2022, over the prior-year period. Gross profit also increased in the quarter to $691,000, from $670,000 in the prior-year period and gross margin was higher (20.8% in Q3-2022 versus 20.6% in Q3-2021). The division’s gross margin in the nine months ended March 31, 2022, of 11.4% was lower than the prior-year period’s 13.5%, mostly due to production inefficiencies experienced during the commencement of operations at the Company’s newly consolidated foundry in Franklin, Indiana.
Engineered Materials Division sales of $2.96 million of beryllium-aluminum products rose by 37.7% in the quarter over the comparable prior-year period and were higher by 91.4% in the nine months ended March 31, 2022, as compared to the comparable prior-year period. Gross margin for the division of 36.7% in the quarter was lower than 45.6% in the prior-year period but is higher YTD, increases to 34.1% in the nine months ended March 31, 2022, from 32.8% in the comparable prior-year period.
Consolidated adjusted earnings before interest, taxes, depreciation, and amortization (“Adjusted EBITDA”)1 for the quarter ended March 31, 2022, was $854,000, a 24.5% increase from $686,000 in the comparable prior-year period. In the nine months ended March 31, 2022, Adjusted EBITDA of $2.2 million jumped 157.4% from 838,000 in the prior-year period. The increase is primarily due to higher sales at our Engineered Materials division.
]
“We are absolutely thrilled to see IBC hit profitability for two quarters in a row and achieve, for the first time in the Company’s history, profitable operations over three quarters of a fiscal year,” said IBC CEO and Chairman Mark A. Smith. “Our Engineered Materials division continues to set new records for output. The Copper Alloys team is growing sales and achieving profitability even as they work tirelessly to complete commissioning and ramp-up operations of our new foundry facility in Franklin, Indiana facility.
“As long as we continue to execute, grow our sales, reduce unit costs, and achieve new levels of operational efficiency, I believe that IBC is likely to beat many expectations in 2022 and beyond.”
Full results can be seen in the Company’s Financial Statements and Management’s Discussion and Analysis (“MD&A”), available at Sedar.ca and on the Company’s website at https://ibcadvancedalloys.com/investors-center/.
| SELECTED RESULTS: Consolidated Operations ($000s)2 | ||||
| Quarter Ended 3-31-2022 |
Quarter Ended 3-31-2021 |
Nine Months Ended 3-31-2022 |
Nine Months Ended 3-31-2021 |
|
| Revenue |
$6,279 |
$5,411 |
$20,493 |
$14,767 |
| Operating Income (Loss) |
$551 |
$478 |
$919 |
($241) |
| Adjusted EBITDA |
$854 |
$686 |
$2,157 |
$838 |
| Income (loss) for the period |
$287 |
$139 |
$50 |
($1,119) |
| SELECTED RESULTS: Copper Alloys ($000s)3 | ||||
| Quarter Ended 3-31-2022 |
Quarter Ended 3-31-2021 |
Nine Months Ended 3-31-2022 |
Nine Months Ended 3-31-2021 |
|
| Revenue |
$3,317 |
$3,260 |
$10,074 |
$9,324 |
| Operating Income (Loss) |
$89 |
$231 |
($607) |
($99) |
| Adjusted EBITDA |
$85 |
$150 |
($286) |
$106 |
| Income (loss) for the period |
$223 |
$205 |
($279) |
($301) |
| SELECTED RESULTS: Engineered Materials ($000s)3 | ||||
| Quarter Ended 3-31-2022 |
Quarter Ended 3-31-2021 |
Nine Months Ended 3-31-2022 |
Nine Months Ended 3-31-2021 |
|
| Revenue |
$2,962 |
$2,151 |
$10,419 |
$5,443 |
| Operating Income |
$607 |
$605 |
$2,002 |
$749 |
| Adjusted EBITDA |
$866 |
$835 |
$2,785 |
$1,388 |
| Income for the period |
$554 |
$490 |
$1,836 |
$581 |
1IBC reports non-IFRS measures such as “Adjusted EBITDA” and “Operating Income”. Please see information on this and other non-IFRS measures in the “Non-IFRS Measures” section of this MD&A.
NON-IFRS MEASURES
To supplement its consolidated financial statements, which are prepared and presented in accordance with IFRS, IBC uses “operating income (loss)” and “Adjusted EBITDA”, which are non-IFRS financial measures. IBC believes that operating income (loss) helps identify underlying trends in the business that could otherwise be distorted by the effect of certain income or expenses that the Company includes in loss for the period, and provides useful information about core operating results, enhances the overall understanding of past performance and future prospects, and allows for greater visibility with respect to key metrics used by management in financial and operational decision-making. The Company believes that Adjusted EBITDA is a useful indicator for cash flow generated by the business that is independent of IBC’s capital structure.
Operating income (loss)1 and Adjusted EBITDA1 should not be considered in isolation or construed as an alternative to loss for the period or any other measure of performance or as an indicator of our operating performance. Operating income (loss) and Adjusted EBITDA presented here may not be comparable to similarly titled measures presented by other companies. Other companies may calculate similarly titled measures differently, limiting their usefulness as comparative measures to IBC’s data.
OPERATING INCOME (LOSS)
Operating income (loss)1 represents income or loss for the quarter, excluding foreign exchange loss, interest expense, interest income, other income (expense) and income taxes that the Company does not believe are reflective of its core operating performance during the periods presented. A reconciliation of the quarter and year-to-date income (loss) to operating income follows:
| Quarter Ended March 31 | 2022 | 2021 |
| ($000s) | ($000s) | |
| Income for the period | 287 | 139 |
| Foreign exchange (gain) loss | 4 | 1 |
| Interest expense | 149 | 353 |
| Loss on disposal of assets | 129 | — |
| Other income | (19) | (15) |
| Income tax expense (recovery) | 1 | — |
| Operating income | 551 | 478 |
| Nine Months Ended March 31 | 2022 | 2021 |
| ($000s) | ($000s) | |
| Gain (loss) for the period | 50 | (1,119) |
| Foreign exchange (gain) loss | 6 | (24) |
| Interest expense | 747 | 924 |
| Gain (loss) on disposal of assets | 108 | (3) |
| Other income | (17) | (39) |
| Income tax expense | 25 | 20 |
| Operating income (loss) | 919 | (241) |
ADJUSTED EBITDA
Adjusted EBITDA1 represents our income (loss) for the period before interest, income taxes, depreciation, amortization, and share-based compensation. A reconciliation of the quarter and year-to-date income (loss) to Adjusted EBITDA1 follows:
| Three months ended March 31 | 2022 | 2021 |
| ($000s) | ($000s) | |
| Income for the period | 287 | 139 |
| Income tax expense (recovery) | 1 | — |
| Interest expense | 149 | 353 |
| Depreciation, amortization, & impairment | 359 | 136 |
| Stock-based compensation expense (non-cash) | 58 | 58 |
| Adjusted EBITDA | 854 | 686 |
| Nine months ended March 31 | 2022 | 2021 |
| ($000s) | ($000s) | |
| Income (loss) for the period | 50 | (1,119) |
| Income tax expense (recovery) | 25 | 20 |
| Interest expense | 747 | 924 |
| Depreciation, amortization, & impairment | 1,140 | 789 |
| Stock-based compensation expense (non-cash) | 195 | 224 |
| Adjusted EBITDA | 2,157 | 838 |
For more information on IBC and its innovative alloy products, go here.
On Behalf of the Board of Directors:
“Mark A. Smith”
Mark A. Smith, CEO & Chairman of the Board
# # #
CONTACTS:
Mark A. Smith, Chairman of the Board
Jim Sims, Investor and Public Relations
IBC Advanced Alloys Corp.
+1 (303) 503-6203
Email: jim.sims@ibcadvancedalloys.com
Website: www.ibcadvancedalloys.com
@IBCAdvanced $IB $IAALF
_________________________________________
ABOUT IBC ADVANCED ALLOYS CORP.
IBC is a leading beryllium and copper advanced alloys company serving a variety of industries such as defense, aerospace, automotive, telecommunications, precision manufacturing, and others. IBC’s Copper Alloys Division manufactures and distributes a variety of copper alloys as castings and forgings, including beryllium copper, chrome copper, and aluminum bronze. IBC’s Engineered Materials Division makes the Beralcast® family of alloys, which can be precision cast and are used in an increasing number of defense, aerospace, and other systems, including the F-35 Joint Strike Fighter. IBC’s has production facilities in Indiana and Massachusetts. The Company’s common shares are traded on the TSX Venture Exchange under the symbol “IB” and the OTCQB under the symbol “IAALF”.
_________________________________________
CAUTIONARY STATEMENTS
The TSX Venture Exchange has not reviewed and does not accept responsibility for the adequacy of this news release. Neither TSX Venture Exchange nor its Regulation Services Provider (as that term is defined in the policies of the TSX Venture Exchange) accepts responsibility for the adequacy or accuracy of this release.
Certain information contained in this news release may be forward-looking information or forward-looking statements as defined under applicable securities laws. Forward-looking information and forward-looking statements are often, but not always identified by the use of words such as “expect”, “anticipate”, “believe”, “foresee”, “could”, “estimate”, “goal”, “intend”, “plan”, “seek”, “will”, “may” and “should” and similar expressions or words suggesting future outcomes. This news release includes forward-looking information and statements pertaining to, among other things, the Company’s expectation of further growth in revenue and market demand, and the ability of the Copper Alloy division to increase its production capacity, reduce unit costs of production, expand its product portfolio and expand into new markets. Forward-looking statements involve substantial known and unknown risks and uncertainties, certain of which are beyond the Company’s control including: the impact of general economic conditions in the areas in which the Company or its customers operate, including the semiconductor manufacturing and oil and gas industries, risks associated with manufacturing activities, changes in laws and regulations including the adoption of new environmental laws and regulations and changes in how they are interpreted and enforced, increased competition, the lack of availability of qualified personnel or management, limited availability of raw materials, fluctuations in commodity prices, foreign exchange or interest rates, stock market volatility and obtaining required approvals of regulatory authorities. As a result of these risks and uncertainties, the Company’s future results, performance or achievements could differ materially from those expressed in these forward-looking statements. All statements included in this press release that address activities, events or developments that the Company expects, believes or anticipates will or may occur in the future are forward-looking statements. These statements are based on assumptions made by the Company based on its experience, perception of historical trends, current conditions, expected future developments and other factors it believes are appropriate in the circumstances.
Please see “Risks Factors” in our Annual Information Form available under the Company’s profile at www.sedar.com, for information on the risks and uncertainties associated with our business. Readers should not place undue reliance on forward-looking information and statements, which speak only as of the date made. The forward-looking information and statements contained in this release represent our expectations as of the date of this release. We disclaim any intention or obligation or undertaking to update or revise any forward-looking information or statements whether as a result of new information, future events or otherwise, except as required under applicable securities laws.