
Highlights of the Year
(Unless otherwise noted, all financial amounts in this news release are expressed in U.S. dollars.)
-
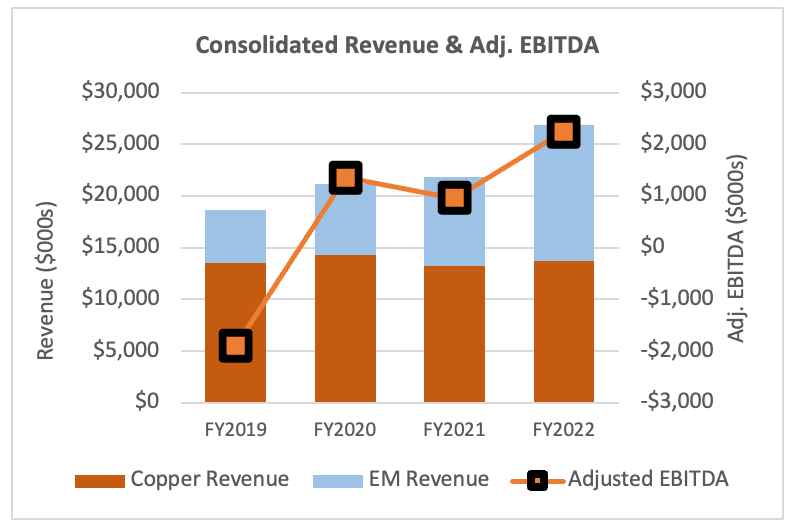
- Consolidated 2022 sales increased by 23.4% over 2021, with Engineered Materials (“EM”) division sales improving 53.7% and Copper Alloy division sales rising by 3.7%. 2022 sales growth marked the fourth year in a row of revenue growth for IBC.
-
- Engineered Materials division achieves fourth straight year of higher revenue and adjusted earnings before interest, taxes, depreciation, and amortization (“Adjusted EBITDA”)1 and third straight year of profitability.
- Engineered Materials division achieves fourth straight year of higher revenue and adjusted earnings before interest, taxes, depreciation, and amortization (“Adjusted EBITDA”)1 and third straight year of profitability.
-
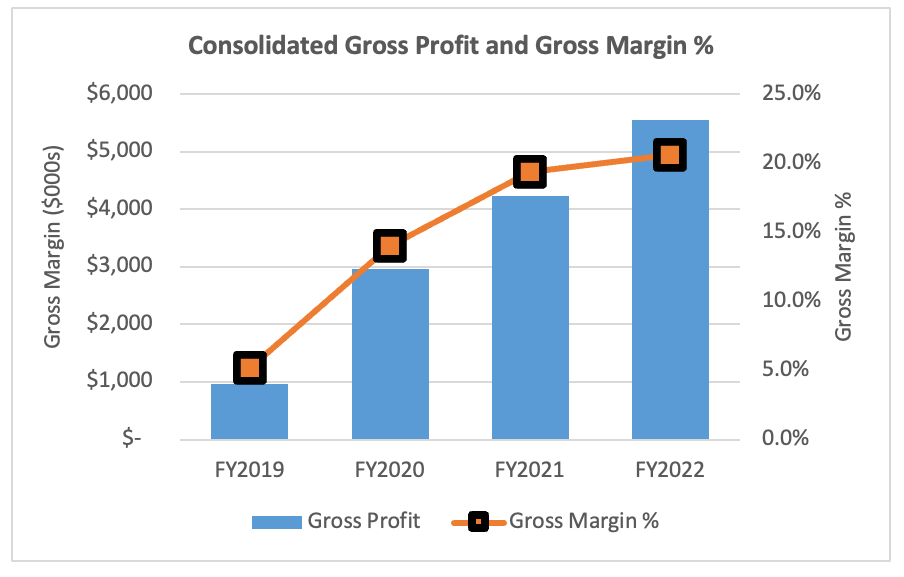
- Gross profit and gross margin for the Copper Alloys division improved in 2022 for the fourth straight year, as did consolidated IBC gross profit and gross margin.
- Gross profit and gross margin for the Copper Alloys division improved in 2022 for the fourth straight year, as did consolidated IBC gross profit and gross margin.
-
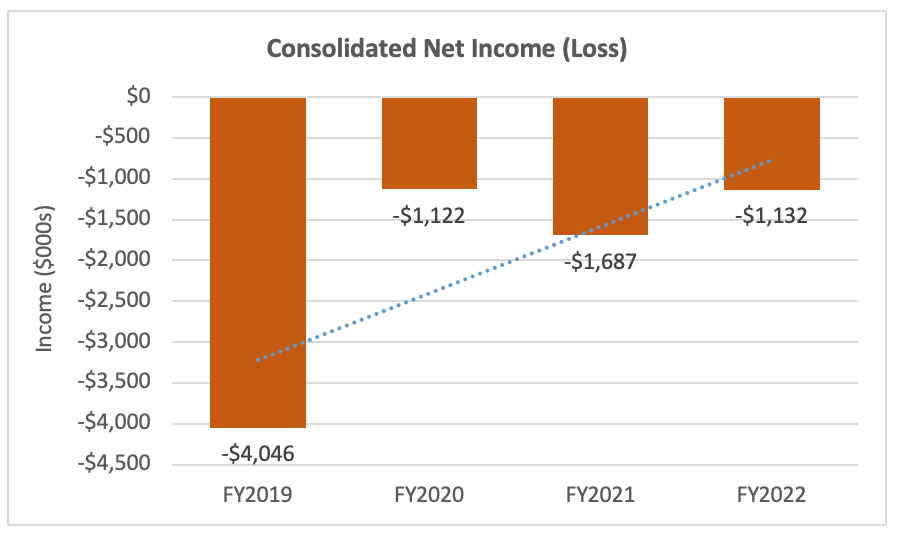
- Consolidated Adjusted EBITDA1 in 2022 rose by 82.4% above the prior year. IBC continued to narrow its consolidated loss in 2022 as compared to the previous three years.
- Consolidated Adjusted EBITDA1 in 2022 rose by 82.4% above the prior year. IBC continued to narrow its consolidated loss in 2022 as compared to the previous three years.
- IBC to host live investor webcast at 4:30 PM Mountain on Tuesday, November 1, 2022, to discuss the Company’s recently issued financial results and its future growth plans. Pre-registration is required and can be done here: https://us06web.zoom.us/meeting/register/tZUtcO2orz8qHdwiyfZ8XYB-d8JO_CyyM5eN
FRANKLIN, Ind. (October 26, 2022) – IBC Advanced Alloys Corp. (“IBC” or the “Company”) (TSX-V: IB; OTCQB: IAALF) announces its financial results for the fourth quarter and year ended June 30, 2022.
IBC’s sales rose 23.4% in the year ended June 30, 2022 to $26.9 million. Copper Alloy division sales edged 3.7% higher in 2022 to $13.7 million, despite the temporary shutdown of its foundries for consolidation into and expansion of the Company’s Franklin, Ind. plant. Engineered Materials (“EM”) division sales in 2022 rose 53.7% to $13.2 million.
In the quarter ended June 30, 2022, consolidated sales declined 8.8% to $6.4 million. Copper Alloy sales were adversely affected by raw materials supply issues, with the result that sales decreased 6.8% in the quarter to $3.6 million. If materials had been available, the sales performance would have been significantly stronger. EM sales declined to $2.8 million in the quarter, compared to $3.2 million in the quarter ended June 30, 2021, being adversely affected by declines in the cyclical demand for chip-making equipment and by a decline in yield, which the EMC division is addressing.
Consolidated gross profit and gross margin improved for the fourth consecutive year to $5.5 million and 20.6%, respectively. The favorable consolidated performance was supported by Copper Alloys recording its fourth straight year of steadily improving gross profit and gross margin. In the EM division, gross profit increased in 2022 to $3.5 million from $2.4 million in 2021. EM’s gross margin declined slightly in 2022 to 26.5% from 28.4% in 2021.

Consolidated Adjusted EBITDA1for the 12 months ended June 30, 2022, was $2.2 million, an 82.4% increase over Adjusted EBITDA1 of $1.2 million in 2021.
“2022 marked the fourth year in a row that IBC was able to expand sales and improve our gross margins, putting us on a solid path to profitability and continued growth,” said IBC CEO and Chairman Mark A. Smith. “I am especially proud of the Copper Alloys team, which grew their sales while they completed an intensive two-year facility consolidation and expansion of our foundry facility in Indiana. The expanded capacity and capabilities this facility provides is already driving order bookings to new levels so far in the current quarter. EM continues to work with customers and prospective customers to develop new applications for Beralcast®, and the Board and I are also looking forward to seeing that business continue to expand in both the defense and commercial sectors.”
Full results can be seen in the Company’s financial statements and management’s discussion and analysis (“MD&A”), available at Sedar.ca and on the Company’s website at https://ibcadvancedalloys.com/investors-center/.
| SELECTED RESULTS: Consolidated Operations ($000s) 1 | ||||
| Quarter Ended 6-30-2022 |
Quarter Ended 6-30-2021 |
12 Months Ended 6-30-2022 |
12 Months Ended 6-30-2021 |
|
| Revenue | $6,419 | $7,042 | $26,911 | $21,809 |
| Gross margin | 13.2% | 16.7% | 20.6% | 19.4% |
| Operating income (loss) | $(662) | $12 | $257 | $253 |
| Adjusted EBITDA1 | $91 | $394 | $2,247 | $1,232 |
| Income (loss) for the period | $(1,183) | $(402) | $(1,132) | ($1,521) |
| Income (loss) per share | $(0.01) | $(0.01) | $(0.01) | $(0.02) |
| SELECTED RESULTS: Copper Alloys ($000s) | ||||
| Quarter Ended 6-30-2022 |
Quarter Ended 6-30-2021 |
12 Months Ended 6-30-2022 |
12 Months Ended 6-30-2021 |
|
| Revenue | $3,619 | $3,885 | $13,692 | $13,209 |
| Gross margin | 24.6% | 13.5% | 14.9% | 13.5% |
| Operating income (loss) | $103 | $118 | ($505) | $18 |
| Adjusted EBITDA1 | $430 | $219 | $144 | $328 |
| Income (loss) for the period | ($38) | $19 | ($317) | ($281) |
| SELECTED RESULTS: Engineered Materials ($000s) | ||||
| Quarter Ended 6-30-2022 |
Quarter Ended 6-30-2021 |
12 Months Ended 6-30-2022 |
12 Months Ended 6-30-2021 |
|
| Revenue | $2,800 | $3,157 | $13,219 | $8,600 |
| Gross margin | -1.5% | 20.7% | 26.5% | 28.4% |
| Operating Income (loss) | $(558) | $207 | $1,444 | $957 |
| Adjusted EBITDA1 | $(213) | $488 | $2,570 | $1,875 |
| Income (loss) for the period | $(614) | $175 | $1,222 | $755 |
LIVE INVESTOR WEBCAST
IBC will host a live investor webcast, featuring CEO and Chairman Mark A. Smith, beginning at 4:30 PM Mountain on Tuesday, November 1, 2022. Those wishing to participate must pre-register here: https://us06web.zoom.us/meeting/register/tZUtcO2orz8qHdwiyfZ8XYB-d8JO_CyyM5eN
NON-IFRS MEASURES
To supplement its consolidated financial statements, which are prepared and presented in accordance with IFRS, IBC uses “operating income (loss)” and “Adjusted EBITDA”, which are non-IFRS financial measures. IBC believes that operating income (loss) helps identify underlying trends in the business that could otherwise be distorted by the effect of certain income or expenses that the Company includes in loss for the period, and provides useful information about core operating results, enhances the overall understanding of past performance and future prospects, and allows for greater visibility with respect to key metrics used by management in financial and operational decision-making. The Company believes that Adjusted EBITDA1 is a useful indicator for cash flow generated by the business that is independent of IBC’s capital structure.
Operating income (loss)1 and Adjusted EBITDA1 should not be considered in isolation or construed as an alternative to loss for the period or any other measure of performance or as an indicator of our operating performance. Operating income (loss) and Adjusted EBITDA1 presented here may not be comparable to similarly titled measures presented by other companies. Other companies may calculate similarly titled measures differently, limiting their usefulness as comparative measures to IBC’s data.
OPERATING INCOME (LOSS)
Operating income (loss)1 represents income or loss for the quarter, excluding foreign exchange loss, interest expense, interest income, other income (expense) and income taxes that the Company does not believe are reflective of its core operating performance during the periods presented. A reconciliation of the quarter and year-to-date loss to operating income (loss) follows:
| Quarter Ended June 30 | 2022 | 2021 |
| ($000s) | ($000s) | |
| Loss for the period | (1,183) | (402) |
| Foreign exchange loss | 27 | 32 |
| Interest expense | 819 | 346 |
| (Gain) loss on disposal of assets | (245) | – |
| (Gain) loss on revaluation of derivative | (83) | — |
| Other income | – | 19 |
| Income tax expense (recovery) | 3 | (7) |
| Operating Loss |
(662) |
(12) |
| Year Ended June 30 | 2022 | 2021 |
| ($000s) | ($000s) | |
| Loss for the period | (1,132) | (1,521) |
| Foreign exchange loss | 33 | 7 |
| Interest expense | 1,566 | 1,270 |
| (Gain) loss on disposal of assets | (137) | |
| (Gain) loss on revaluation of derivative | (83) | (2) |
| Other income | (18) | (20) |
| Income tax expense (recovery) | 28 | 13 |
| Operating income (loss) | 257 | (253) |
ADJUSTED EBITDA
Adjusted EBITDA1 represents our income (loss) for the period before interest, income taxes, depreciation, amortization, and share-based compensation. A reconciliation of the quarter and year-to-date loss to Adjusted EBITDA1 follows:
| Three months ended June 30 | 2022 | 2021 |
| ($000s) | ($000s) | |
| Loss for the period | (1,183) | (402) |
| Income tax expense (recovery) | 3 | (7) |
| Interest expense | 819 | 346 |
| Gain on revaluation of derivative | (83) | – |
| Depreciation & amortization | 410 | 394 |
| Stock-based compensation expense (non-cash) | 125 | 63 |
| Adjusted EBITDA | 91 | 394 |
| Year ended June 30 | 2022 | 2021 |
| ($000s) | ($000s) | |
| Income (loss) for the period | (1,132) | (1,521) |
| Income tax expense (recovery) | 28 | 13 |
| Interest expense | 1,566 | 1,270 |
| (Gain) loss on revaluation of derivative | (83) | – |
| Depreciation, amortization, & Impairment | 1,549 | 1,183 |
| Stock-based compensation expense (non-cash) | 319 | 287 |
| Adjusted EBITDA | 2,247 | 1,232 |
For more information on IBC and its innovative alloy products, go here.
On Behalf of the Board of Directors:
“Mark A. Smith”
Mark A. Smith, CEO & Chairman of the Board
# # #
CONTACTS:
Mark A. Smith, Chairman of the Board
Jim Sims, Director of Investor and Public Relations
+1 (303) 503-6203
Email: jim.sims@ibcadvancedalloys.com
Website: www.ibcadvancedalloys.com@IBCAdvanced $IB $IAALF
ABOUT IBC ADVANCED ALLOYS CORP.
IBC is a leading beryllium and copper advanced alloys company serving a variety of industries such as defense, aerospace, automotive, telecommunications, precision manufacturing, and others. IBC’s Copper Alloys Division manufactures and distributes a variety of copper alloys as castings and forgings, including beryllium copper, chrome copper, and aluminum bronze. IBC’s Engineered Materials Division makes the Beralcast® family of alloys, which can be precision cast and are used in an increasing number of defense, aerospace, and other systems, including the F-35 Joint Strike Fighter. IBC’s has production facilities in Indiana and Massachusetts. The Company’s common shares are traded on the TSX Venture Exchange under the symbol “IB” and the OTCQB under the symbol “IAALF”.
CAUTIONARY STATEMENTS
The TSX Venture Exchange has not reviewed and does not accept responsibility for the adequacy of this news release. Neither TSX Venture Exchange nor its Regulation Services Provider (as that term is defined in the policies of the TSX Venture Exchange) accepts responsibility for the adequacy or accuracy of this release.
Certain information contained in this news release may be forward-looking information or forward-looking statements as defined under applicable securities laws. Forward-looking information and forward-looking statements are often, but not always identified by the use of words such as “expect”, “anticipate”, “believe”, “foresee”, “could”, “estimate”, “goal”, “intend”, “plan”, “seek”, “will”, “may” and “should” and similar expressions or words suggesting future outcomes. This news release includes forward-looking information and statements pertaining to, among other things, the Company’s expectation of further growth in revenue and market demand, and the ability of the Copper Alloy division to increase its production capacity, reduce unit costs of production, expand its product portfolio and expand into new markets. Forward-looking statements involve substantial known and unknown risks and uncertainties, certain of which are beyond the Company’s control including: the impact of general economic conditions in the areas in which the Company or its customers operate, including the semiconductor manufacturing and oil and gas industries, risks associated with manufacturing activities, changes in laws and regulations including the adoption of new environmental laws and regulations and changes in how they are interpreted and enforced, increased competition, the lack of availability of qualified personnel or management, limited availability of raw materials, fluctuations in commodity prices, foreign exchange or interest rates, stock market volatility and obtaining required approvals of regulatory authorities. As a result of these risks and uncertainties, the Company’s future results, performance or achievements could differ materially from those expressed in these forward-looking statements. All statements included in this press release that address activities, events or developments that the Company expects, believes or anticipates will or may occur in the future are forward-looking statements. These statements are based on assumptions made by the Company based on its experience, perception of historical trends, current conditions, expected future developments and other factors it believes are appropriate in the circumstances.
Please see “Risks Factors” in our Annual Information Form available under the Company’s profile at www.sedar.com, for information on the risks and uncertainties associated with our business. Readers should not place undue reliance on forward-looking information and statements, which speak only as of the date made. The forward-looking information and statements contained in this release represent our expectations as of the date of this release. We disclaim any intention or obligation or undertaking to update or revise any forward-looking information or statements whether as a result of new information, future events or otherwise, except as required under applicable securities laws.
[1] IBC reports non-IFRS measures such as “Adjusted EBITDA” and “Operating Income.” Please see information on this and other non-IFRS measures in the “Non-IFRS Measures” section of this news release and in IBC’s MD&A, available on Sedar.com